Windsor Greenhouse Gas Emissions
Windsor’s Greenhouse Gas Emissions
The City of Windsor’s greenhouse gas inventory is divided into two overarching categories: “Community”, which refers to the aggregate emissions of all sectors operating within Windsor, and “Corporate,” which pertains solely to emissions generated via the activities of the Corporation of the City of Windsor
Community Greenhouse Gas (GHG) Emissions
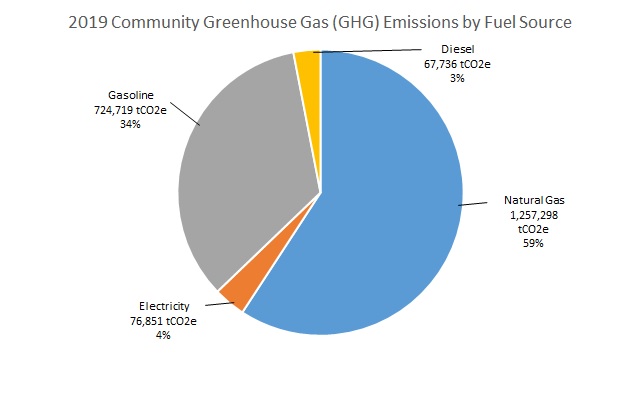
Community emissions sources include the residential, commercial and institutional, industrial, transportation and solid waste sectors. Community greenhouse gas emissions for 2019 are estimated to have totalled 1.8 million tonnes of carbon dioxide equivalent (tCO2e), or more than 8.4 tonnes per person.
.jpg)

As can be seen in the chart above, natural gas use is the primary cause of greenhouse gas emissions in Windsor. Natural gas use is responsible for 59% of greenhouse gas emissions by utility, dwarfing electricity at 4%, the other significant energy source used in buildings. The Transportation sector, fuels for which include gasoline, diesel and ethanol, make up 40% of the Windsor community's greenhouse gas emissions. The Residential, Industrial and Commercial & Institutional sectors each produce from 10% to 27% of community emissions, while the Municipal sector (the Corporation of the City of Windsor) is responsible for about 2% of emissions.
The concentration of industrial activity in Windsor is a significant contributor to the significant use of natural gas in the city. Industrial processes and heating of large factories are large users of natural gas and are a considerable source of emissions. That said, compared to the European average, North American industry, like that in Windsor, tends to be quite efficient, using only about 20% more energy. Moreover, automotive companies like Chrysler and Ford are some of the most efficient global companies in the world. While there remains room for improvement, industry's prioritization of efficiency has provided it with a head-start compared to the broader economy with regards to energy management.
Like industry, the residential sector is a significant energy user in Windsor. Unlike industry, however, efficiencies are hardly comparable. Compared to the European Union average, buildings in North America consume 80% to 150% more energy than their European counterparts.
This trend is fully on display in Windsor, where energy consumption per household is greater than in comparable cities in Canada and globally. Households in Windsor use about 35% more energy than the Ontarian and Canadian averages, and more than double the energy of the average Danish home. Likewise, per square meter of floor space, homes in Windsor use more than 25% more energy than the average Canadian home, and nearly 3.5 times as much energy as German A-rates homes.


Corporate Greenhouse Gas Emissions
As seen below, the Corporation of the City of Windsor's Municipal emissions, which account for about 1% of community emissions, totalled 37,307 tonnes of carbon dioxide equivalent (tCO2e) in 2019, the most recent year for which information is available. The Building sector is responsible for the largest portion of these emissions at 46%, followed by the Corporate Fleet and Transit Services (27%), Water & Sewage (27%) and Streetlights (1%).
.jpg)
.jpg)
The City of Windsor's Corporate Climate Action Plan has been developed concurrently with the Community Energy Plan to address emissions produced by the Corporation of the City of Windsor.
For more information on environmental initiatives:
Phone: For general information, call 311. For detailed inquiries, call 519-255-6100 ext. 6109.
Email: emp@citywindsor.ca
