Community Greenhouse Gas Emissions
Objective A4: Reduce and Monitor Community Greenhouse Gas Emissions
The following actions are needed to complete this objective:
- Work with various stakeholders and partners to implement the Community Energy Plan (2017) relating to local air quality including:
- Encouraging a modal shift towards public transit
- Encouraging active transportation
- Fostering the adoption of electric vehicles
- Continuing to advance smart energy systems
- Continue to track corporate and community greenhouse gas emissions as part of the Federation of Canadian Municipalities Partners for Climate Protection, as well as the Compact of Mayors and publish in the Report on the State of the Environment.
These indicators show the progress the City is making to achieve this objective:
- Community greenhouse gas emissions (targets to align with the Community Energy Plan, 2017)
- Corporate greenhouse gas emissions (targets to align with the Corporate Climate Action Plan, 2017)
Greenhouse Gas Emissions Indicator
 The Intergovernmental Panel on Climate Change (IPCC) was established by the United Nations and is universally recognized as the leading authority on the science of climate change. The most recent findings from the IPCC conclude that climate change is "unequivocal" and that human activity is the main cause.
The burning of fossil fuels to meet the demand for energy coupled with deforestation has caused the greenhouse gas (GHG) concentrations to shift out of balance. The primary and most talked about GHG is carbon dioxide. Methane, nitrous oxides, sulphur oxides and volatile organic compounds are also GHGs contributing to global warming.
In 2019, according to NASA, the level of carbon dioxide (CO2) in the atmosphere has grown to 412 parts per million (ppm), a nearly 47 percent increase from pre-industrial levels. Concentrations of other GHG have also increased greatly.
Greenhouse gases work like a greenhouse, trapping heat from the Earth that would otherwise escape. GHGs, when in a natural balance with other gases make life on earth possible. As the concentration of GHGs in the atmosphere increases, the ability for these gases to trap heat increases. Over the last century, the mean temperature on Earth has increased by 1°C, in Canada the mean temperature has risen by over 1.5°C. The past five years have been the hottest five on record.
The impacts of global warming are much more than just a mean temperature increase of a couple of degrees. With the rise in temperatures, glaciers around the world are melting, and there has been a notable increase in the number of extreme weather events, such as hurricanes, tornadoes, and flooding. The term "climate change" is now being used instead of the term "global warming."
High levels of greenhouse gases can also be associated with poor air quality.
How are we doing?
Greenhouse gas emissions are inventoried for both the corporate City of Windsor and the community at large. The inventory includes GHGs from electricity, district energy and natural gas consumption; fuels required for vehicles; and waste disposal. Waste disposal is not included in the corporate inventory, as corporate waste is not tracked separately from community waste. The inventory is designed to estimate GHGs generated from different sources of energy (i.e. electricity, natural gas, gasoline, diesel, etc.) and presents the findings as equivalent tonnes of carbon dioxide (eCO2).
Visit the Corporate Energy Initiatives page for more details about the energy reporting requirements under the Green Energy Act Ontario Regulation 397/11.
The City of Windsor's Corporate eCO2 emissions
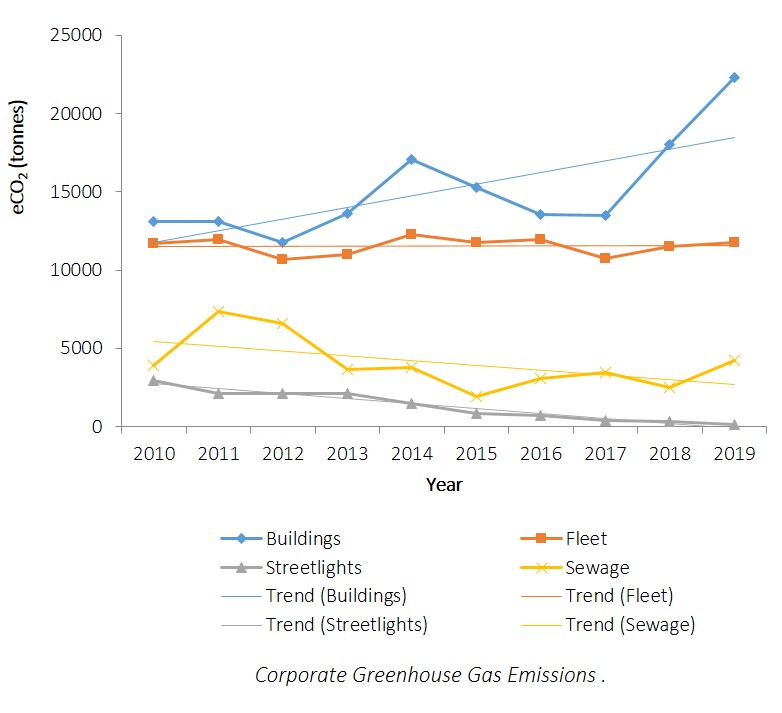
The above graph charts corporate greenhouse gas emissions between 2010 and 2019. The City of Windsor's building emissions increased in 2014 following the opening of Adventure Bay and Fire Hall 7. The rainy conditions also increased the electrical demand for the City's wastewater system. An increase in corporate building emissions in 2018 and beyond is attributed to the conversion to combined heat and power systems at both Huron Lodge and the WFCU Centre, which produce more heat and emissions than electricity from the grid.
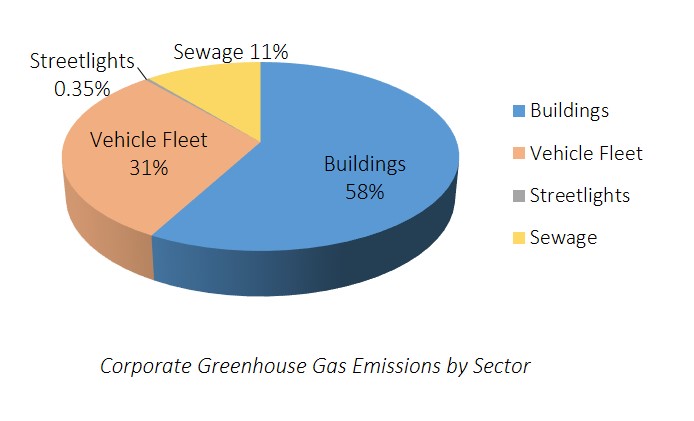
As detailed in the chart above, in 2019, our corporate greenhouse gas emissions were broken down into the following categories: 58% from buildings, 31% from vehicle fleet, 0.35% from streetlights and 11% from sewage treatment.
The City of Windsor's Community eCO2 emissions
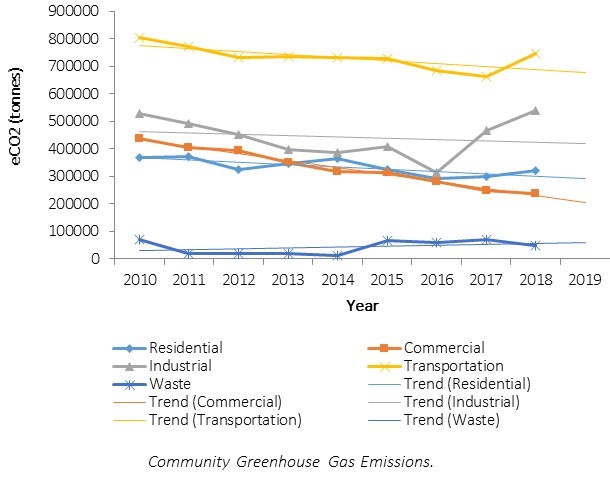
As detailed in the graph above, as a community, Windsor’s greenhouse gas emissions from the transportation and commercial sectors have decreased slightly since 2010. Greenhouse gas emissions from the residential and industrial sectors as well as waste have remained about the same since 2010.
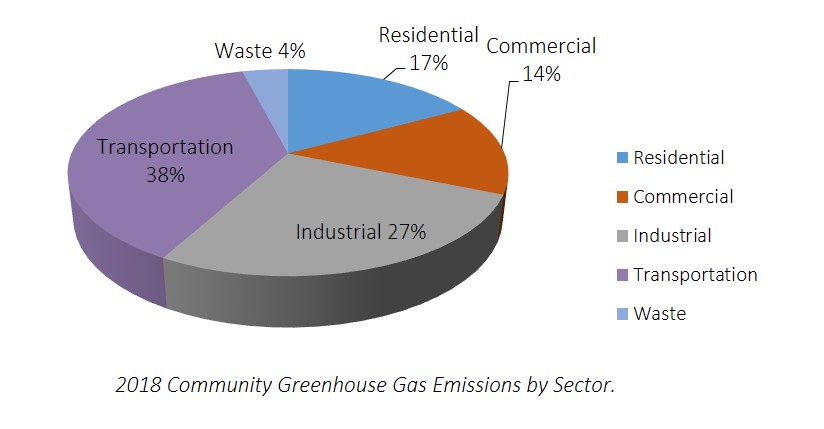
As detailed in the chart above, in 2018, the community greenhouse gas emissions were broken down into the following categories: 17% from residential units,14% from commercial businesses, 27% from industry, 38% from transportation and 4% from waste disposal.
For more details see the City of Windsor's baseline greenhouse gas inventory.
As detailed in the graph above, as a community, Windsor’s greenhouse gas emissions from the transportation and commercial sectors have decreased slightly since 2010. Greenhouse gas emissions from the residential and industrial sectors as well as waste have remained about the same since 2010.
As detailed in the chart above, in 2018, the community greenhouse gas emissions were broken down into the following categories: 17% from residential units,14% from commercial businesses, 27% from industry, 38% from transportation and 4% from waste disposal.
What's the City of Windsor doing to lower Greenhouse Gas Emissions?
- In 2002, The City of Windsor has joined Partners for Climate Protection, a network of over 350 Canadian municipal governments that have committed to reducing greenhouse gases and acting on climate change. Partners for Climate Protection has developed a five-milestone framework to guide municipalities through a proven strategy on climate change protection. The five milestones are as follows:
- Milestone One - Emissions Inventory
- Milestone Two - Emissions Reduction Target
- Milestone Three - Action Plan
- Milestone Four - Implement, Monitor, Report and Verify
- Milestone Five - Monitoring Progress and Reporting Results
- In an effort to reduce energy use by the municipality, an energy audit has been completed for all facilities and a Corporate Energy Management Plan has been developed.
- The City of Windsor has converted all traffic signals and streetlights over to light emitting diode (LED) technology.
- A Climate Change Adaptation Plan has been created, as well as a Corporate Climate Action Plan, and a Community Energy Plan.
- The City of Windsor is investigating a Deep Energy Efficiency Retrofit Program for residential retrofits.
- The City also has an Integrated Site Energy Master Plan for the Lou Romano Water Reclamation Plant and the Little River Pollution Control Plant.
What can you do to help reduce the greenhouse gas emissions for the community?
Learn more about activities that contribute to greenhouse gas emissions and what you can do to help. Visit the following indicator pages for more information.
For more information on environmental initiatives: