Key Energy Successes 2014 2018
Key Energy Successes 2014-2018
The implementation of recommendations resulting from initiating energy audits and related studies has generated the following savings, reductions or revenues for the period 2014-2018:
- Total electricity savings – 17.7 million kWh or 19.8% reduction compared to 2014 consumption
- Total electricity cost savings – $2.94 million or 23.2% compared to 2014 costs
- Total natural gas reduction (2014-2017) – 680,000 cubic metres natural gas
- Annual electricity production PV Systems - 2 million kWh
- Annual corporate revenues PV Systems - $750,000
- Annual combined-heat-and-power (CHP) electricity displacement - 3.2 million kWh (2018 production)
- Annual combined-heat-and-power (CHP) thermal displacement - 475,000 cubic meters natural gas
- Annual GHG emissions reduction - 1631 tonnes
Below are abstracts of a variety of projects completed by the Energy Initiatives unit.
Combined Heat and Power (CHP)
In 2017/2018, the City installed two combined heat and power systems. The CHP units are located at the Huron Lodge Long Term Care Facility and the WFCU Centre sports complex and have an installed capacity of 400 and 800 kW respectively. When fully operational they will displace over 6.7 million kWh from the provincial grid and provide 65% of the heating load of the two sites. The anticipated combined operational savings are estimated to be $631,000 annually.
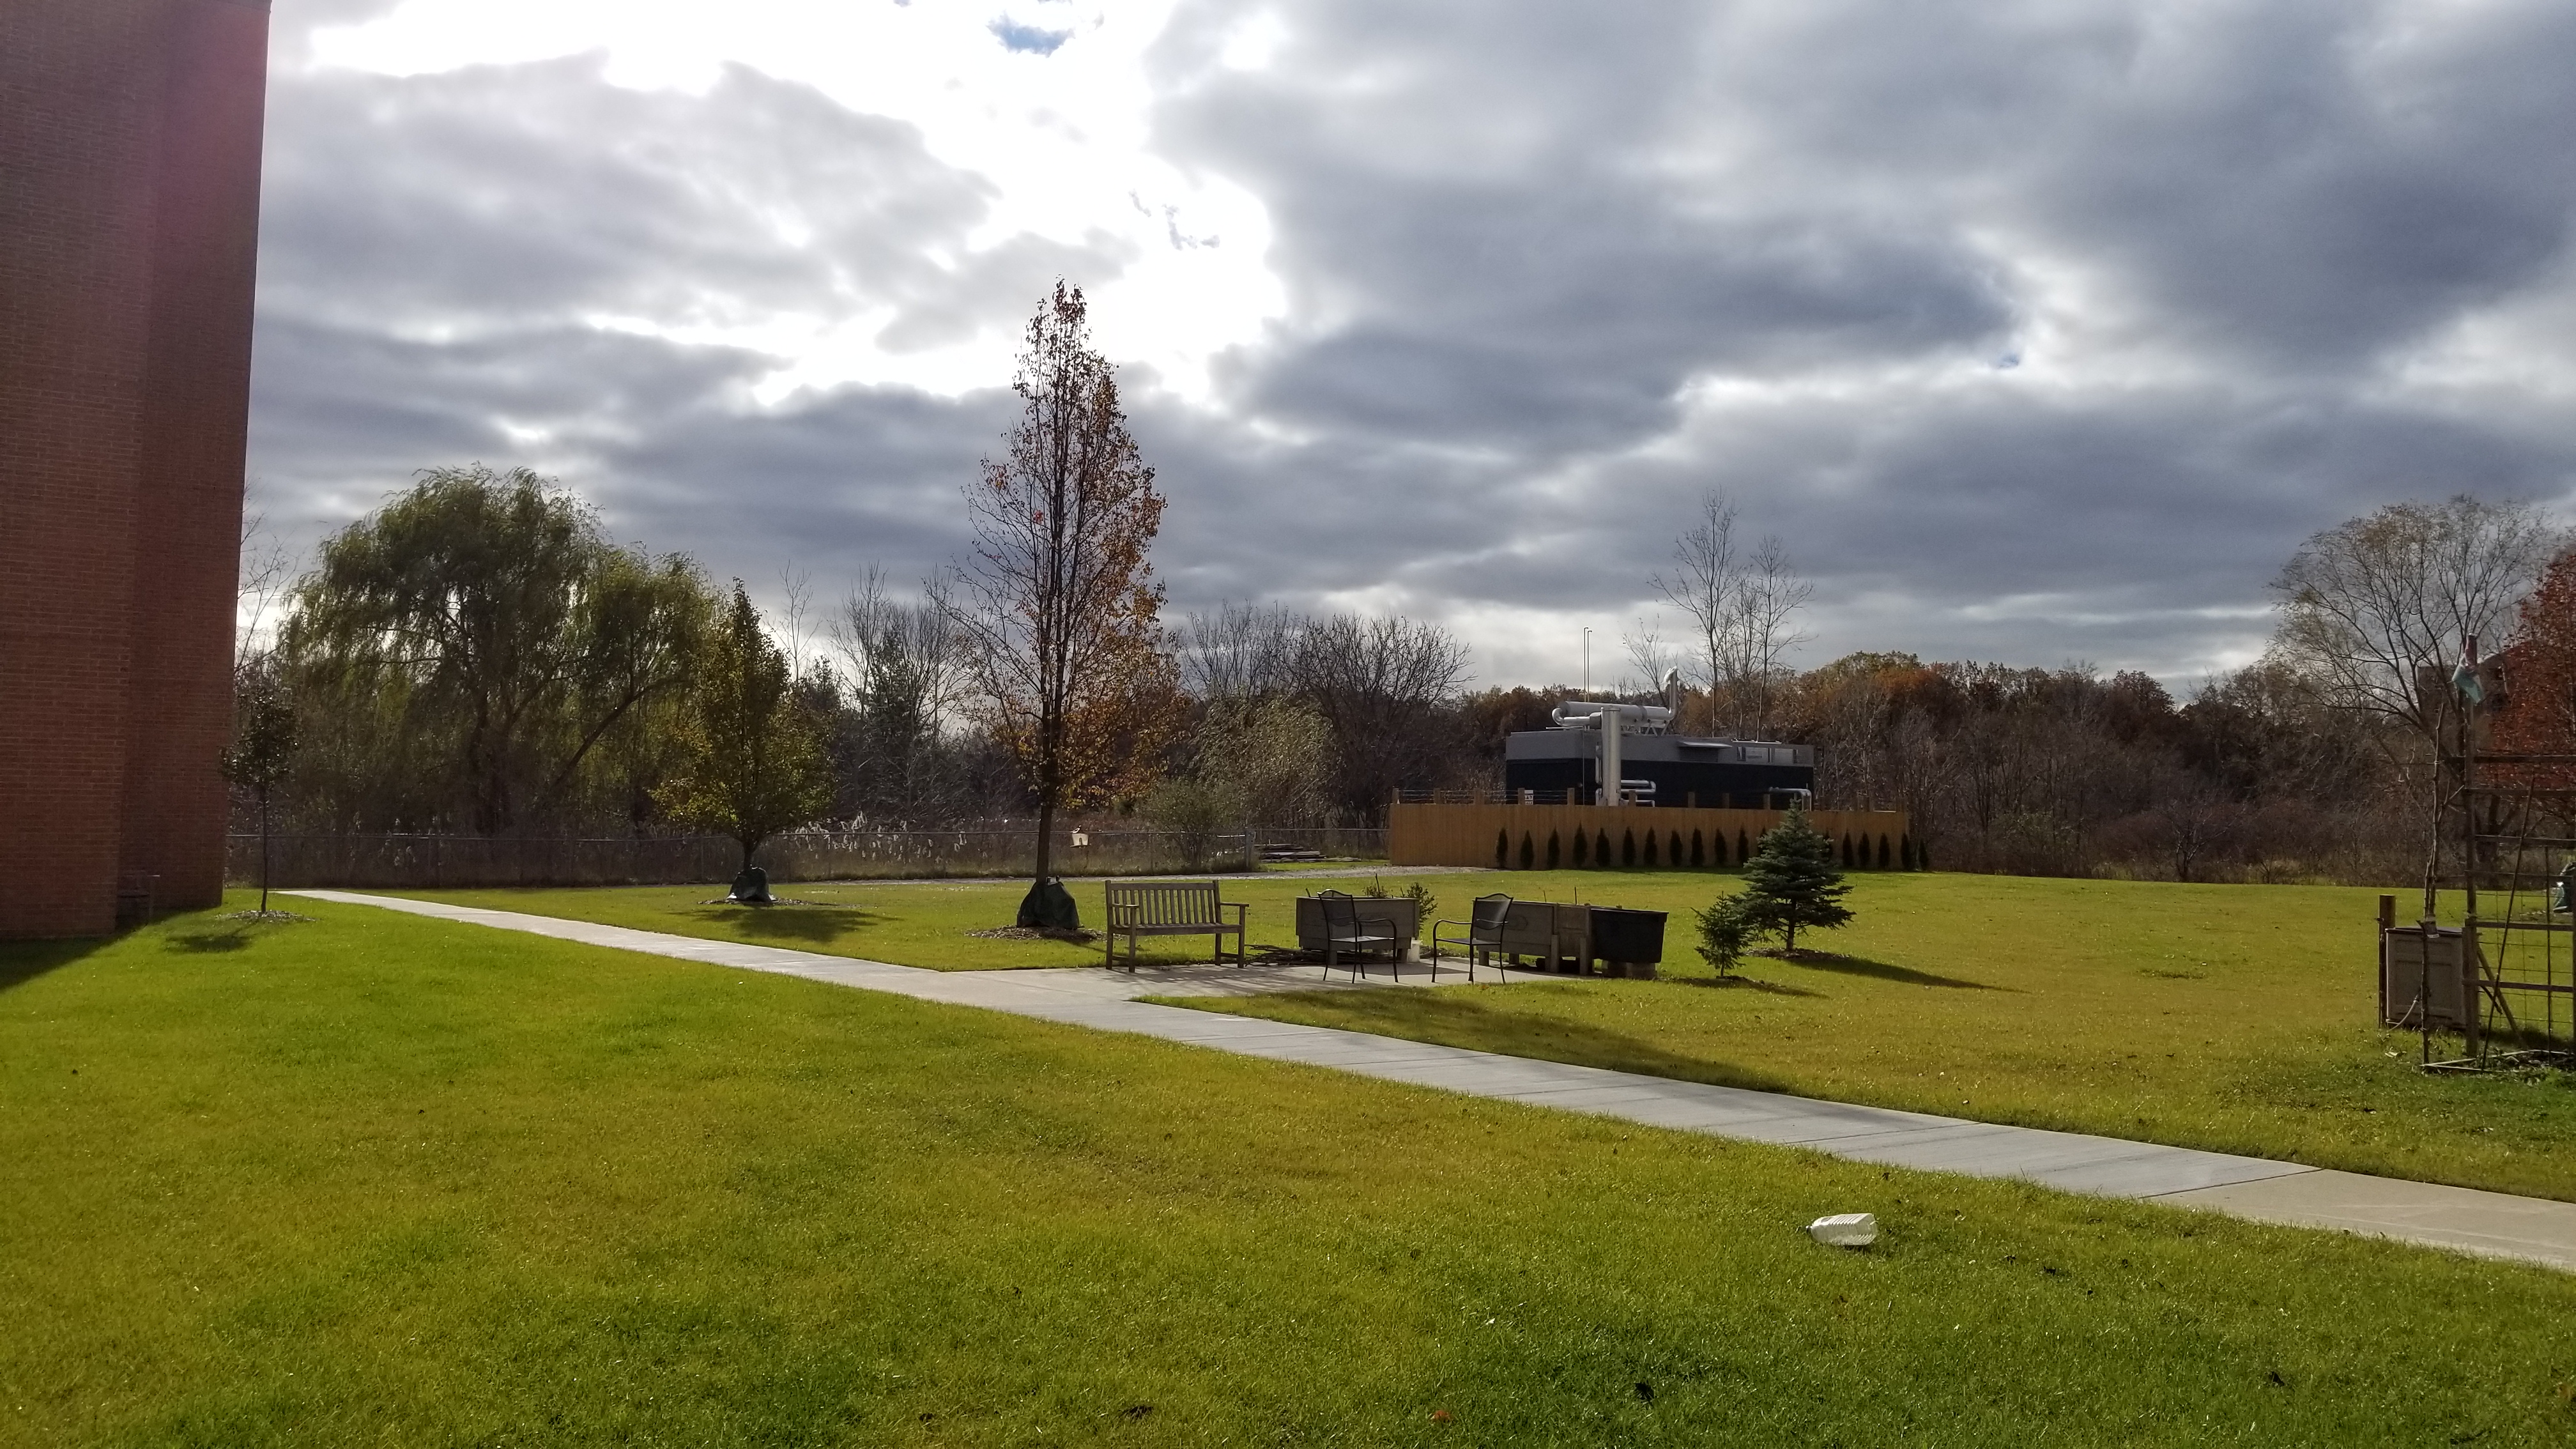
The picture below reflects the actual CHP unit located the Huron Lodge Long Term Care Facility.
Streetlights Conversion to LED
Renewable Energy/Photovoltaic Rooftop Systems
The City has installed three (3) photovoltaic rooftop systems with a combined capacity of 1.35 MW. These PV projects have an annual electricity output of approximately 2.0 million kWh and generate income of $750,000.
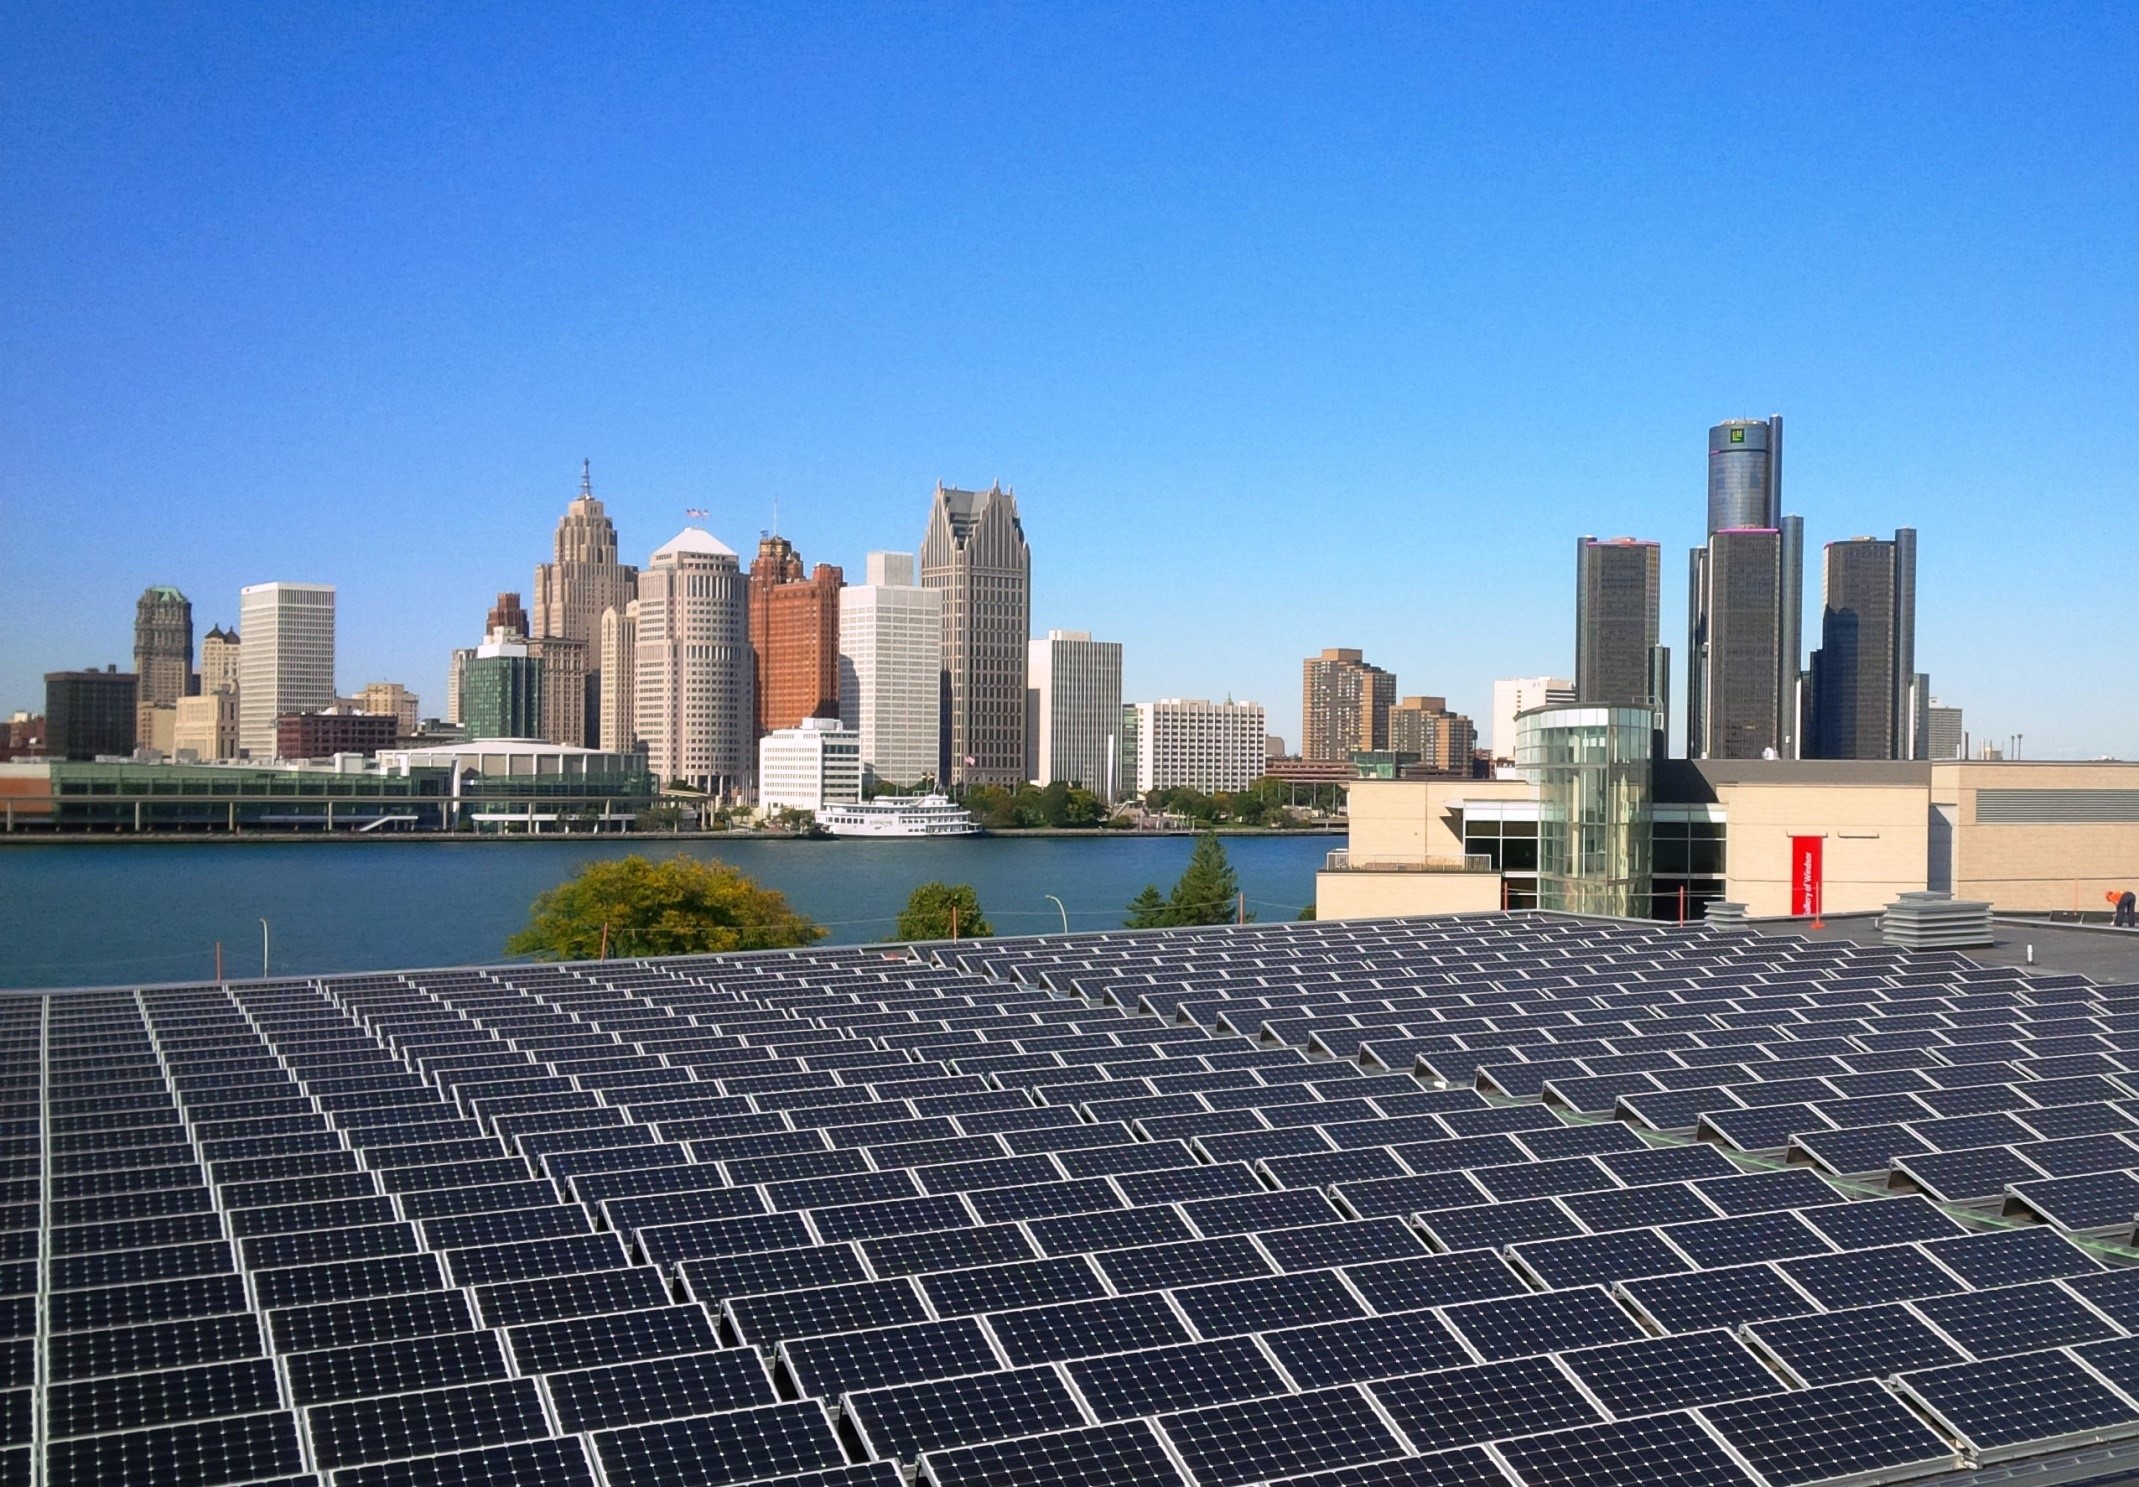
The picture below depicts the PV solar array of 1,200 panels installed at the WIATC in downtown Windsor.
Building Optimization Pilot Project (BOP)
In 2016, the City of Windsor was asked to participate in a pilot project with the Independent Electricity System Operator (IESO) and CLEAResult Engineering Consulting to perform 30 building optimization studies of the City’s highest electricity users. Buildings with over 125,000 kWh of annual consumption were identified and evaluated for low-cost and no-cost electricity conservation opportunities. An assessment of potential capital-cost upgrades was also performed for each of the 30 sites.
WFCU Centre Upgrades
The Industrial Conservation Initiative (ICI)
This is an electricity cost reduction program administered by the Province of Ontario’s Independent Electricity System Operator (IESO).
One of the initiatives within the ICI program allows large electricity customers with average monthly electricity peak demand greater than one (1) MW to reduce their costs by reclassifying from Class B to Class A accounts. Class A accounts enjoy the benefit of lower Global Adjustment costs. The City reclassified the Lou Romano Water Reclamation Plant, Little River Pollution Control Plant and the Windsor International Aquatic and Training Centre Presented by WFCU Credit Union. This has resulted in electricity cost savings in excess of $1.2 million for the period July 2017 to June 2018.
Energy Management Software
In April 2016, the City implemented EnergyCAP, an energy management software solution to assist with data monitoring and verification of the City’s 600 utility accounts. The automated system eliminated various manual efforts rendering more efficient staff time dedicated to other projects. Among the many benefits, EnergyCAP dramatically improved the budget process, the ability to analyze energy information and run reports in a timely manner.
In addition to saving valuable staff time, it is estimated implementing the software will generate energy related savings/cost avoidance ranging between $50,000 and $100,000 annually.
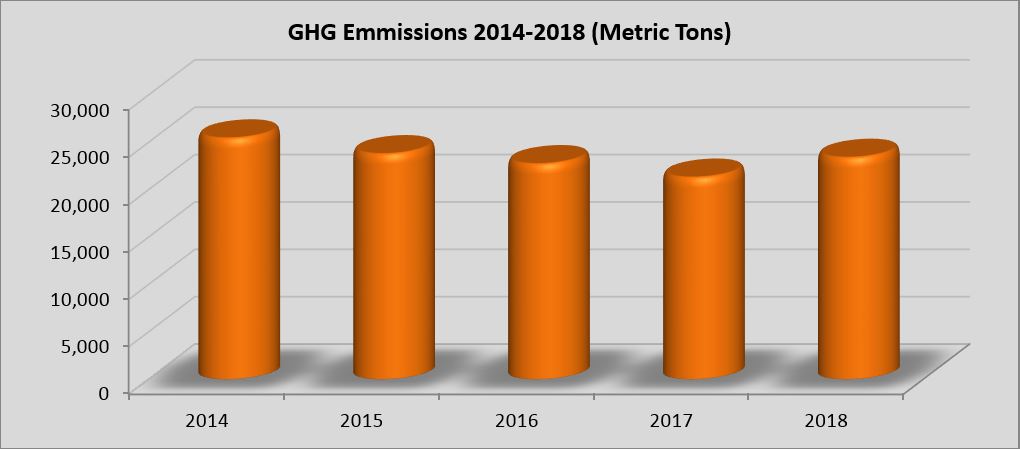
Greenhouse Gas (GHG) Emission Reduction
The City’s efforts to achieve both energy and cost savings also result in another equally important outcome: reducing the City’s carbon footprint by reducing GHG emissions. Identifying reductions in carbon dioxide (CO2) emissions by translating abstract measurements into everyday terms can be a helpful reference. Implementing the various measures contained herein, GHG emissions during the period 2014-2018 were reduced by approximately 1,631 metric tons and are equivalent to the following:
- Taking 499 vehicles off the road, or
- Electricity annual usage of 382 homes, or
- Carbon sequestered effect of 1,918 acres of forests.
The graph below (Figure 1) identifies the amount of GHGs emitted from the City’s building and facilities. The reduction in carbon dioxide (CO2) emissions for the period 2014-2017 is reflective of the various energy efficiency measures that were implemented. The increase in 2018 is in part the result of commissioning two CHP systems.
Figure 1 – GHG Emissions 2014-2018
Historical Consumption and Cost Data 2014-2018
Energy management starts with understanding how and when energy is used. The scope of this analysis is limited to energy use of electricity, natural gas, water, and district heating and cooling within the City’s building portfolio, including streetlights.
Table 1 below identifies the annual corporate consumption and corresponding costs for the period 2014-2018. The following information describes the energy and water consumption over this 5-year period.
Table 1 – Annual Energy Consumption & Cost 2014-2018
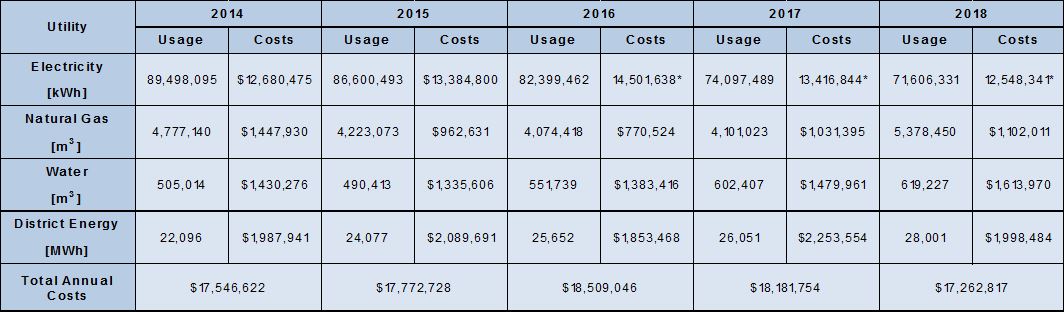
*Energy Initiatives fund a number of energy efficiency projects by allocating the anticipated annual operational savings against the capital cost of the project until the capital cost is fully recovered. Allocations/transfer have occurred as follows: 2016, $152,751; 2017, $1,320,394; 2018, $1,701,727. The electricity costs in Table 1 include those annual transfers as stated, meaning that the true cost of electricity in those years would be less by those transfer values.
Consumption 2014-2018 by Utility Type
The graphs below depict consumption by utility type for the period 2014-2018. During this period, the City added the following facilities that have increased the energy and water consumption:
- January 2014 – full opening of the Windsor International Aquatic and Training Centre Presented by WFCU Credit Union
- January 2016 – addition of the Windsor Public Library
- June 2016 – addition of a 25-meter indoor pool at WFCU Centre
- August 2016 – addition of a 12,000 sq. ft. Community Center at the Capri Pizzeria Recreation Complex
- 2016/2017 – replaced three Fire Halls
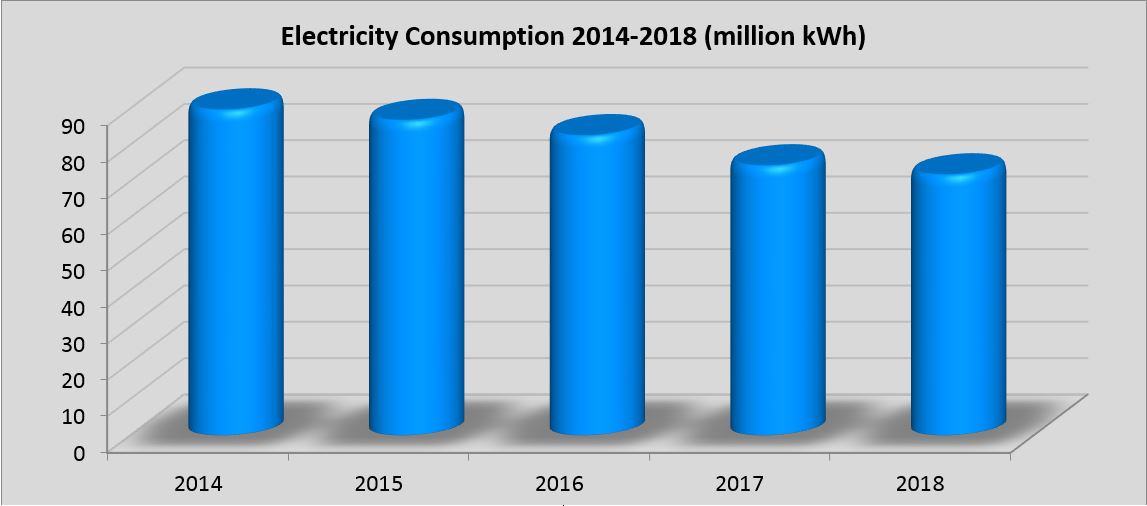
Electricity
As depicted in Figure 2, electricity consumption decreased by 19.8% between 2014-2018 or 17.7 million kWh and has reduced GHG emissions by 357 metric tons. This reduction is due to the energy efficiency programs implemented during the 5-year period. Overall costs have decreased by approximately 1% compared to 2014.
Figure 2 – City of Windsor Electricity Usage
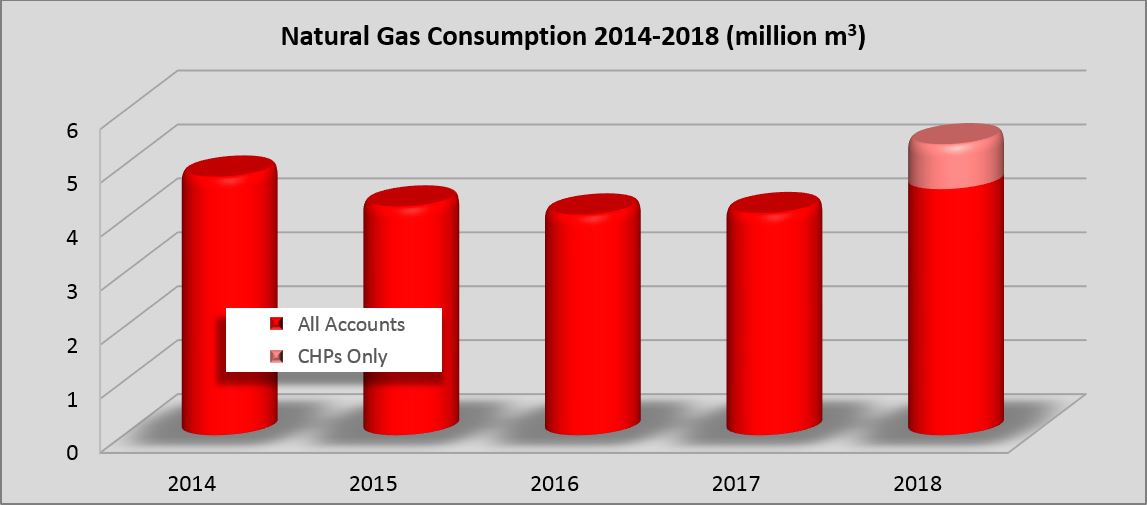
Natural Gas
As depicted in Figure 3 below, natural gas consumption decreased by approximately 680,000 cubic metres between 2014 and 2017 as the result of numerous efficiency measures. This decrease has reduced GHG emissions by 1,277 metric tons. The increase of approximately 800,000 cubic meters in 2018 is primarily the result of two CHP systems becoming operational. Commodity prices have been trending lower mainly due to significant shale gas well-drilling creating record high storage capacity. Total costs have decrease by 23.9% and cost per cubic meter also declined by 32.4% since 2014.
Figure 3 – City of Windsor Natural Gas Usage
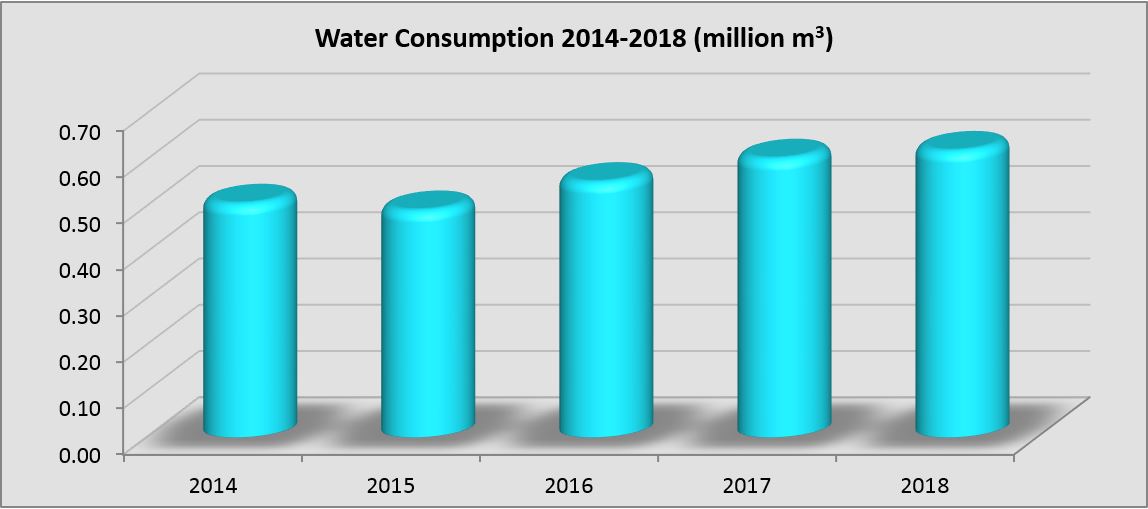
Water
Water consumption has remained relatively stable during the period 2014-2018. As indicated in Figure 4, a consumption increase occurred in 2016 due to the addition of Windsor Public Libraries to the corporate portfolio, as well as the installation of a 25-meter pool at the WFCU Centre. In 2018, several site-related operational anomalies also caused consumption and cost to increase which have since been corrected.
Figure 4 – City of Windsor Water Usage
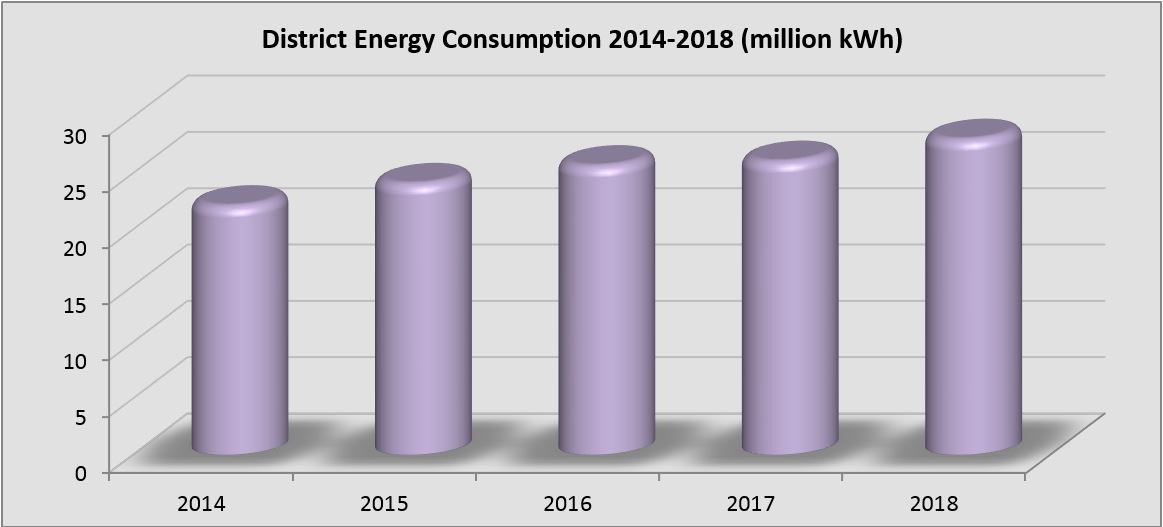
District Energy Windsor
District Energy is the utilization from a central source that provides chilled water for cooling and hot water for heating to buildings in the district energy loop. The central source in Windsor is located at Caesars Windsor Hotel and Casino. As depicted by the graph below, consumption presented a marginal increase. The City currently has six facilities located in the downtown area that are serviced by District Energy Windsor including the new 350 City Hall Square West completed in May of 2018. Figure 5 below combines the consumption of both chilled and hot water usage.
Figure 5 – City of Windsor District Energy Usage
Electricity Consumption by Municipal Sector
Electricity is by far the corporation’s largest cost driver representing 73% (2018) of the total annual utility expenditures. The following chart displays the 2018 electricity usage by the various municipal service sectors.
As depicted in figure 6 below, the two water treatment plants and pumping stations together with parks and recreation facilities account for 68.8% of the annual electricity consumed. Accordingly, a significant number of energy initiatives will continue to be planned and implemented for these larger users.
Figure 6 – Electricity Consumption by Sector 2018
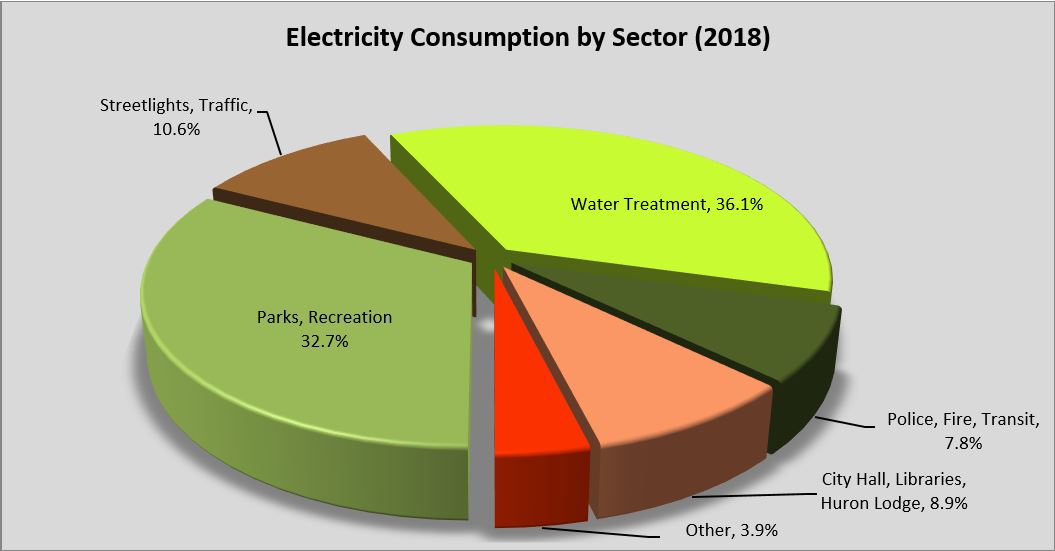
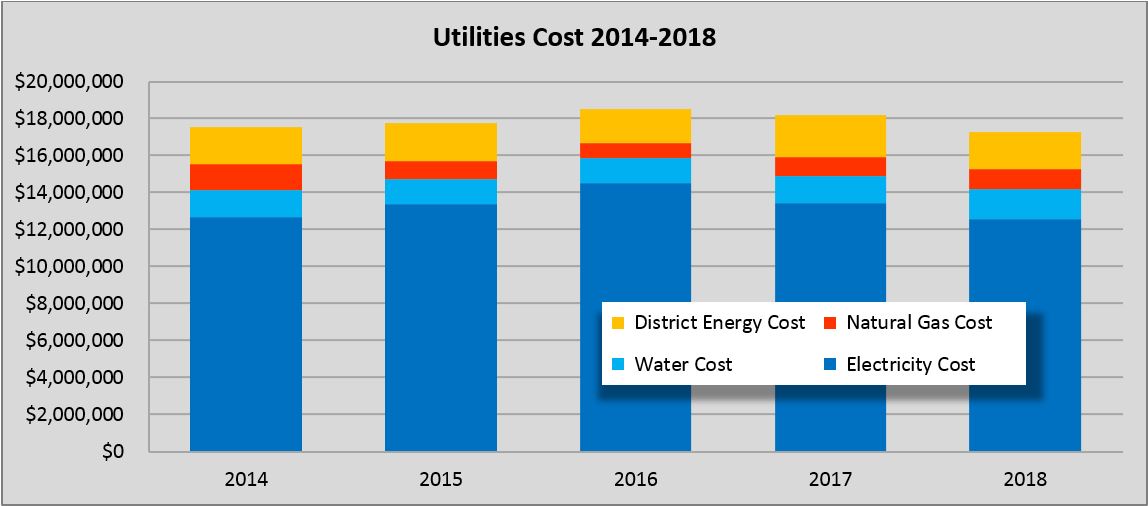
Figure 7 identifies annual costs by utility type, with electricity being the more significant cost driver.
Figure 7 – Annual Cost by Utility Type
For general information, call 311. For detailed inquiries, call 519-255-6100.